


Census Tract 9400.01, Brown County, Wisconsin
About
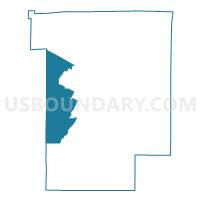
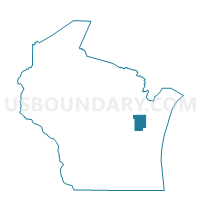
Outline

Summary
| Unique Area Identifier | 504360 |
| Name | Census Tract 9400.01 |
| County | Brown County |
| State | Wisconsin |
| Area (square miles) | 54.24 |
| Land Area (square miles) | 53.49 |
| Water Area (square miles) | 0.75 |
| % of Land Area | 98.61 |
| % of Water Area | 1.39 |
| Latitude of the Internal Point | 44.46595470 |
| Longtitude of the Internal Point | -88.16016690 |
| Total Population | 14,585 |
| Total Housing Units | 5,809 |
| Total Households | 5,500 |
| Median Age | 37.6 |
Maps
Graphs
Select a template below for downloading or customizing gragh for Census Tract 9400.01, Brown County, Wisconsin


Neighbors
Neighoring Census Tract (by Name) Neighboring Census Tract on the Map
- Census Tract 102.01, Brown County, WI
- Census Tract 102.02, Brown County, WI
- Census Tract 103, Brown County, WI
- Census Tract 133, Outagamie County, WI
- Census Tract 205.02, Brown County, WI
- Census Tract 205.03, Brown County, WI
- Census Tract 205.04, Brown County, WI
- Census Tract 213.02, Brown County, WI
- Census Tract 213.03, Brown County, WI
- Census Tract 213.04, Brown County, WI
- Census Tract 214, Brown County, WI
- Census Tract 9400, Outagamie County, WI
- Census Tract 9400.02, Brown County, WI
- Census Tract 9400.03, Brown County, WI
Top 10 Neighboring County Subdivision (by Population) Neighboring County Subdivision on the Map
- Green Bay city, Brown County, WI (104,057)
- De Pere city, Brown County, WI (23,800)
- Howard village, Brown County, WI (17,399)
- Ashwaubenon village, Brown County, WI (16,963)
- Ledgeview town, Brown County, WI (6,555)
- Hobart village, Brown County, WI (6,182)
- Oneida town, Outagamie County, WI (4,678)
- Lawrence town, Brown County, WI (4,284)
- Wrightstown town, Brown County, WI (2,221)
- Rockland town, Brown County, WI (1,734)
Top 10 Neighboring Place (by Population) Neighboring Place on the Map
- Green Bay city, WI (104,057)
- De Pere city, WI (23,800)
- Howard village, WI (17,399)
- Ashwaubenon village, WI (16,963)
- Hobart village, WI (6,182)
Top 10 Neighboring Unified School District (by Population) Neighboring Unified School District on the Map
- Green Bay Area School District, WI (136,070)
- Howard-Suamico School District, WI (28,500)
- Kaukauna Area School District, WI (22,458)
- De Pere Unified School District, WI (21,243)
- West De Pere School District, WI (20,396)
- Pulaski Community School District, WI (19,371)
- Ashwaubenon School District, WI (15,975)
- Seymour Community School District, WI (12,917)
- Freedom Area School District, WI (9,097)
- Wrightstown Community School District, WI (6,771)
Top 10 Neighboring State Legislative District Lower Chamber (by Population) Neighboring State Legislative District Lower Chamber on the Map
- Assembly District 5, WI (61,133)
- Assembly District 2, WI (61,009)
- Assembly District 90, WI (56,344)
- Assembly District 4, WI (54,953)
Top 10 Neighboring State Legislative District Upper Chamber (by Population) Neighboring State Legislative District Upper Chamber on the Map
- State Senate District 1, WI (180,989)
- State Senate District 30, WI (173,432)
- State Senate District 2, WI (172,047)
Top 10 Neighboring 111th Congressional District (by Population) Neighboring 111th Congressional District on the Map
Top 10 Neighboring 5-Digit ZIP Code Tabulation Area (by Population) Neighboring 5-Digit ZIP Code Tabulation Area on the Map
- 54115, WI (41,178)
- 54313, WI (35,897)
- 54304, WI (28,153)
- 54130, WI (25,108)
- 54165, WI (7,539)
- 54155, WI (5,451)
Data
Demographic, Population, Households, and Housing Units
** Data sources from census 2010 **
Show Data on Map
Download Full List as CSV
Download Quick Sheet as CSV
| Subject | This Area | Brown County | Wisconsin | National |
|---|---|---|---|---|
| POPULATION | ||||
| Total Population Map | 14,585 | 248,007 | 5,686,986 | 308,745,538 |
| POPULATION, HISPANIC OR LATINO ORIGIN | ||||
| Not Hispanic or Latino Map | 14,325 | 230,022 | 5,350,930 | 258,267,944 |
| Hispanic or Latino Map | 260 | 17,985 | 336,056 | 50,477,594 |
| POPULATION, RACE | ||||
| White alone Map | 12,820 | 214,415 | 4,902,067 | 223,553,265 |
| Black or African American alone Map | 82 | 5,491 | 359,148 | 38,929,319 |
| American Indian and Alaska Native alone Map | 1,038 | 6,715 | 54,526 | 2,932,248 |
| Asian alone Map | 315 | 6,724 | 129,234 | 14,674,252 |
| Native Hawaiian and Other Pacific Islander alone Map | 9 | 104 | 1,827 | 540,013 |
| Some Other Race alone Map | 42 | 9,155 | 135,867 | 19,107,368 |
| Two or More Races Map | 279 | 5,403 | 104,317 | 9,009,073 |
| POPULATION, SEX | ||||
| Male Map | 7,218 | 122,658 | 2,822,400 | 151,781,326 |
| Female Map | 7,367 | 125,349 | 2,864,586 | 156,964,212 |
| POPULATION, AGE (18 YEARS) | ||||
| 18 years and over Map | 10,678 | 186,184 | 4,347,494 | 234,564,071 |
| Under 18 years | 3,907 | 61,823 | 1,339,492 | 74,181,467 |
| POPULATION, AGE | ||||
| Under 5 years | 1,059 | 17,167 | 358,443 | 20,201,362 |
| 5 to 9 years | 1,122 | 17,147 | 368,617 | 20,348,657 |
| 10 to 14 years | 1,066 | 17,123 | 375,927 | 20,677,194 |
| 15 to 17 years | 660 | 10,386 | 236,505 | 12,954,254 |
| 18 and 19 years | 280 | 7,070 | 162,704 | 9,086,089 |
| 20 years | 98 | 3,550 | 80,763 | 4,519,129 |
| 21 years | 109 | 3,489 | 78,216 | 4,354,294 |
| 22 to 24 years | 487 | 10,368 | 227,573 | 12,712,576 |
| 25 to 29 years | 910 | 17,644 | 372,347 | 21,101,849 |
| 30 to 34 years | 1,000 | 16,333 | 349,347 | 19,962,099 |
| 35 to 39 years | 961 | 15,689 | 345,328 | 20,179,642 |
| 40 to 44 years | 1,141 | 17,189 | 380,338 | 20,890,964 |
| 45 to 49 years | 1,243 | 19,430 | 437,627 | 22,708,591 |
| 50 to 54 years | 1,177 | 18,393 | 436,126 | 22,298,125 |
| 55 to 59 years | 956 | 15,869 | 385,986 | 19,664,805 |
| 60 and 61 years | 360 | 5,425 | 135,437 | 7,113,727 |
| 62 to 64 years | 471 | 6,946 | 178,388 | 9,704,197 |
| 65 and 66 years | 264 | 3,671 | 96,316 | 5,319,902 |
| 67 to 69 years | 332 | 4,797 | 130,713 | 7,115,361 |
| 70 to 74 years | 404 | 6,567 | 173,467 | 9,278,166 |
| 75 to 79 years | 246 | 5,281 | 141,252 | 7,317,795 |
| 80 to 84 years | 151 | 4,209 | 117,061 | 5,743,327 |
| 85 years and over | 88 | 4,264 | 118,505 | 5,493,433 |
| MEDIAN AGE BY SEX | ||||
| Both sexes Map | 37.60 | 36.20 | 38.50 | 37.20 |
| Male Map | 37.00 | 35.20 | 37.30 | 35.80 |
| Female Map | 38.10 | 37.20 | 39.60 | 38.50 |
| HOUSEHOLDS | ||||
| Total Households Map | 5,500 | 98,383 | 2,279,768 | 116,716,292 |
| HOUSEHOLDS, HOUSEHOLD TYPE | ||||
| Family households: Map | 4,171 | 63,721 | 1,468,917 | 77,538,296 |
| Husband-wife family Map | 3,600 | 49,148 | 1,131,344 | 56,510,377 |
| Other family: Map | 571 | 14,573 | 337,573 | 21,027,919 |
| Male householder, no wife present Map | 191 | 4,577 | 103,625 | 5,777,570 |
| Female householder, no husband present Map | 380 | 9,996 | 233,948 | 15,250,349 |
| Nonfamily households: Map | 1,329 | 34,662 | 810,851 | 39,177,996 |
| Householder living alone Map | 1,008 | 27,267 | 642,507 | 31,204,909 |
| Householder not living alone Map | 321 | 7,395 | 168,344 | 7,973,087 |
| HOUSEHOLDS, HISPANIC OR LATINO ORIGIN OF HOUSEHOLDER | ||||
| Not Hispanic or Latino householder: Map | 5,437 | 94,052 | 2,194,432 | 103,254,926 |
| Hispanic or Latino householder: Map | 63 | 4,331 | 85,336 | 13,461,366 |
| HOUSEHOLDS, RACE OF HOUSEHOLDER | ||||
| Householder who is White alone | 4,944 | 89,566 | 2,045,544 | 89,754,352 |
| Householder who is Black or African American alone | 27 | 1,552 | 122,878 | 14,129,983 |
| Householder who is American Indian and Alaska Native alone | 364 | 2,256 | 18,213 | 939,707 |
| Householder who is Asian alone | 92 | 1,627 | 35,407 | 4,632,164 |
| Householder who is Native Hawaiian and Other Pacific Islander alone | 4 | 29 | 548 | 143,932 |
| Householder who is Some Other Race alone | 12 | 2,290 | 35,432 | 4,916,427 |
| Householder who is Two or More Races | 57 | 1,063 | 21,746 | 2,199,727 |
| HOUSEHOLDS, HOUSEHOLD TYPE BY HOUSEHOLD SIZE | ||||
| Family households: Map | 4,171 | 63,721 | 1,468,917 | 77,538,296 |
| 2-person household Map | 1,891 | 28,325 | 680,856 | 31,882,616 |
| 3-person household Map | 877 | 14,168 | 319,637 | 17,765,829 |
| 4-person household Map | 860 | 12,683 | 276,516 | 15,214,075 |
| 5-person household Map | 374 | 5,530 | 121,740 | 7,411,997 |
| 6-person household Map | 111 | 1,885 | 43,643 | 3,026,278 |
| 7-or-more-person household Map | 58 | 1,130 | 26,525 | 2,237,501 |
| Nonfamily households: Map | 1,329 | 34,662 | 810,851 | 39,177,996 |
| 1-person household Map | 1,008 | 27,267 | 642,507 | 31,204,909 |
| 2-person household Map | 286 | 6,254 | 136,394 | 6,360,012 |
| 3-person household Map | 22 | 791 | 19,899 | 992,156 |
| 4-person household Map | 12 | 241 | 8,016 | 411,171 |
| 5-person household Map | 1 | 79 | 2,647 | 126,634 |
| 6-person household Map | 0 | 17 | 861 | 48,421 |
| 7-or-more-person household Map | 0 | 13 | 527 | 34,693 |
| HOUSING UNITS | ||||
| Total Housing Units Map | 5,809 | 104,371 | 2,624,358 | 131,704,730 |
| HOUSING UNITS, OCCUPANCY STATUS | ||||
| Occupied Map | 5,500 | 98,383 | 2,279,768 | 116,716,292 |
| Vacant Map | 309 | 5,988 | 344,590 | 14,988,438 |
| HOUSING UNITS, OCCUPIED, TENURE | ||||
| Owned with a mortgage or a loan Map | 3,188 | 47,596 | 1,082,099 | 52,979,430 |
| Owned free and clear Map | 971 | 16,989 | 469,459 | 23,006,644 |
| Renter occupied Map | 1,341 | 33,798 | 728,210 | 40,730,218 |
| HOUSING UNITS, VACANT, VACANCY STATUS | ||||
| For rent Map | 101 | 2,620 | 63,268 | 4,137,567 |
| Rented, not occupied Map | 5 | 124 | 3,695 | 206,825 |
| For sale only Map | 59 | 1,204 | 34,219 | 1,896,796 |
| Sold, not occupied Map | 19 | 174 | 5,741 | 421,032 |
| For seasonal, recreational, or occasional use Map | 59 | 670 | 193,046 | 4,649,298 |
| For migrant workers Map | 0 | 0 | 249 | 24,161 |
| Other vacant Map | 66 | 1,196 | 44,372 | 3,652,759 |
| HOUSING UNITS, OCCUPIED, AVERAGE HOUSEHOLD SIZE BY TENURE | ||||
| Total: Map | 2.64 | 2.45 | 2.43 | 2.58 |
| Owner occupied Map | 2.86 | 2.62 | 2.56 | 2.65 |
| Renter occupied Map | 1.97 | 2.14 | 2.16 | 2.44 |
| HOUSING UNITS, OCCUPIED, TENURE BY RACE OF HOUSEHOLDER | ||||
| Owner occupied: Map | 4,159 | 64,585 | 1,551,558 | 75,986,074 |
| Householder who is White alone Map | 3,833 | 61,594 | 1,466,172 | 63,446,275 |
| Householder who is Black or African American alone Map | 10 | 227 | 37,360 | 6,261,464 |
| Householder who is American Indian and Alaska Native alone Map | 235 | 843 | 8,742 | 509,588 |
| Householder who is Asian alone Map | 43 | 767 | 17,078 | 2,688,861 |
| Householder who is Native Hawaiian and Other Pacific Islander alone Map | 3 | 9 | 279 | 61,911 |
| Householder who is Some Other Race alone Map | 6 | 756 | 12,746 | 1,975,817 |
| Householder who is Two or More Races Map | 29 | 389 | 9,181 | 1,042,158 |
| Renter occupied: Map | 1,341 | 33,798 | 728,210 | 40,730,218 |
| Householder who is White alone Map | 1,111 | 27,972 | 579,372 | 26,308,077 |
| Householder who is Black or African American alone Map | 17 | 1,325 | 85,518 | 7,868,519 |
| Householder who is American Indian and Alaska Native alone Map | 129 | 1,413 | 9,471 | 430,119 |
| Householder who is Asian alone Map | 49 | 860 | 18,329 | 1,943,303 |
| Householder who is Native Hawaiian and Other Pacific Islander alone Map | 1 | 20 | 269 | 82,021 |
| Householder who is Some Other Race alone Map | 6 | 1,534 | 22,686 | 2,940,610 |
| Householder who is Two or More Races Map | 28 | 674 | 12,565 | 1,157,569 |
| HOUSING UNITS, OCCUPIED, TENURE BY HISPANIC OR LATINO ORIGIN OF HOUSEHOLDER | ||||
| Owner occupied: Map | 4,159 | 64,585 | 1,551,558 | 75,986,074 |
| Not Hispanic or Latino householder Map | 4,125 | 63,092 | 1,516,656 | 69,617,625 |
| Hispanic or Latino householder Map | 34 | 1,493 | 34,902 | 6,368,449 |
| Renter occupied: Map | 1,341 | 33,798 | 728,210 | 40,730,218 |
| Not Hispanic or Latino householder Map | 1,312 | 30,960 | 677,776 | 33,637,301 |
| Hispanic or Latino householder Map | 29 | 2,838 | 50,434 | 7,092,917 |
| HOUSING UNITS, OCCUPIED, TENURE BY HOUSEHOLD SIZE | ||||
| Owner occupied: Map | 4,159 | 64,585 | 1,551,558 | 75,986,074 |
| 1-person household Map | 458 | 12,503 | 325,993 | 16,453,569 |
| 2-person household Map | 1,680 | 25,333 | 623,027 | 27,618,605 |
| 3-person household Map | 726 | 10,455 | 241,709 | 12,517,563 |
| 4-person household Map | 806 | 10,122 | 220,084 | 10,998,793 |
| 5-person household Map | 342 | 4,186 | 91,979 | 5,057,765 |
| 6-person household Map | 98 | 1,287 | 31,002 | 1,965,796 |
| 7-or-more-person household Map | 49 | 699 | 17,764 | 1,373,983 |
| Renter occupied: Map | 1,341 | 33,798 | 728,210 | 40,730,218 |
| 1-person household Map | 550 | 14,764 | 316,514 | 14,751,340 |
| 2-person household Map | 497 | 9,246 | 194,223 | 10,624,023 |
| 3-person household Map | 173 | 4,504 | 97,827 | 6,240,422 |
| 4-person household Map | 66 | 2,802 | 64,448 | 4,626,453 |
| 5-person household Map | 33 | 1,423 | 32,408 | 2,480,866 |
| 6-person household Map | 13 | 615 | 13,502 | 1,108,903 |
| 7-or-more-person household Map | 9 | 444 | 9,288 | 898,211 |
Loading...